Skip to content

Math

Playing with a Rational Distribution

(Note to reader: I think I wrote this post for myself. From an outside perspective, it's by far the most boring one I've ever written. But it's math that's been occupying my mind for a week and from an inside perspective it's been quite fun. Maybe you'll find the fun in it that I did.)

For a project I'm currently working on at GitHub, I ran into my first statistical distribution defined on rational numbers and I found it weird and interesting when compared to the continuous distributions that I'm used to. We were looking at feature adoption on a per-repository basis. We defined adoption to be

\[\textrm{adoption}=\frac{\textrm{number of people using feature in a given repo}}{\textrm{number of people active in that repo}}\]

The question is, what should the distribution of feature adoption look like across all repos? Pause here and think about it. (Don't even scroll down!) Leaning upon my normal intuition with continuous distributions I was initially a bit surprised with what I found.

EARRRL – the Estimated Average Recent Request Rate Limiter - the Mathy Bits

In the companion post I introduced a problem with naive, window-based rate limiters – they're too forgiving! The user's request count is stored in a key in Redis with a TTL of, say, 15 minutes, and once the key expires, the abusive user can come back and immediately offend again. Effectively the abusive user is using your infrastructure to rate limit their requests.

In this post we'll investigate an alternative approach to windowed rate limiting which keeps a running estimate of each user's request rate and rejects requests for users whose rate is above the prescribed threshold. The focus of this post is on the math behind the approach. For a practical implementation, usage, and motivation for why the math might be worth looking at, please take a look at the companion post.

Aircraft Control Theory - Applied to Product Growth

exponential distribution and percentile error

Once upon a time, a long time ago, I was an aerospace engineer. One of the main goals of an aerospace engineer is (duh) to make sure you keep aircraft safely in the air. To do this, you must make sure that the aircraft is stable. Simplistically, stability indicates that the forces acting upon the aircraft tend to correct any perturbation that acts upon the aircraft. For example, if a gust of wind pitches the nose of the aircraft upward, then an unstable aircraft will pitch further upward and soon start back flipping. A stable aircraft, on the other hand, will be naturally forced back towards level flight. I was recently reminded of my aerospace background when reading a blog post by Brian Balfour (et al.) about product feedback loops. His description of product feedback loops is, surprisingly, quite analogous to the aircraft feedback loops we see with aircraft. However, instead of air pressure forcing the aircraft to tip backwards more and more, we see things like social sharing causing a product to gain in more and more popularity. An interesting difference between aircraft dynamics and product dynamics is that, while you want aircraft to dampen out perturbations and return to straight and level flight, you want products to exhibit instability – you want a slight jump in popularity to give rise to more and more popularity and trigger exponential growth. It seems, then, that aerospace engineering may provide interesting tools for understanding just how to trigger exponential product growth. Let's dig in!

A Sketch for a new Distribution Sketch

About three and a half years ago I came up with a clever trick for accurately approximating and tightly bounding a cumulative distribution in a rather small data structure. It's high time that I blogged about it! In this post I'll talk about the problem space, my technique, the potential benefits of my approach over other approaches, and ways to improve in the future.

Understanding Eigenvector Centrality with the Metaphor of Political Power

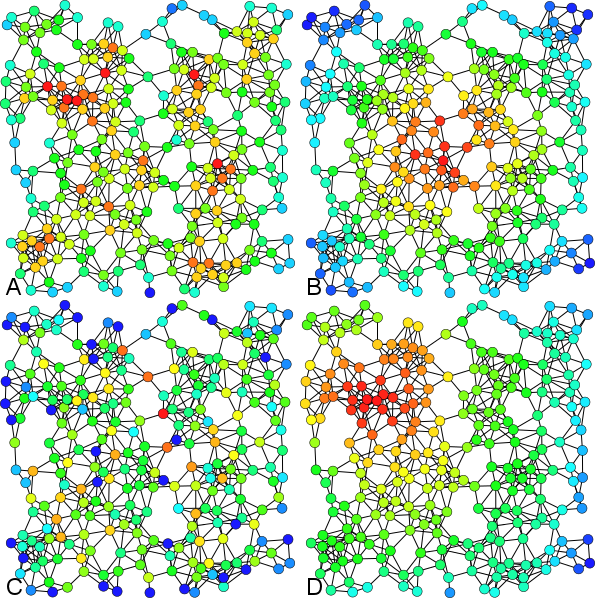
If you play around much with graphs, one of the first things that you'll run into is the idea of network centrality. Centrality is a value associated with a node which represents how important and how central that node is to the network as a whole. There are actually quite a few way of defining network centrality - here are just a few:

missing
Examples of A) Degree centrality, B) Closeness centrality, C) Betweenness centrality, D) Eigenvector centrality. -- Figure shamelessly stolen from Wikipedia
  • Degree centrality - This, the simplest measure of centrality, is simply the count of how many a connections a particular node has.
  • Closeness centrality - This is the inverse of a node's farness. Farness, in turn, is the sum of the length of the shortest paths connecting the node in question to all other nodes.
  • Betweenness centrality - This is the count of number of shortest paths that pass through a given node.

But, my favorite measure of centrality is eigenvector centrality. Why? Because I invented it! Ok, ok... that's not exactly true, but I did at least independently discover it. And the way I discovered it helped it stick in my mind ever since.