I've been playing with my Twitter social graph recently, and it occurred to me that the people that I'm friends with form several clusters. I wanted to see if I could come up with some sort of clustering algorithm to identify these clusters. Why? Well for one, it could be of practical use; maybe I can find some good use for it. But, perhaps more than that, I was curious if I could make a clustering algorithm – I've kinda got a thing for reinventing wheels.
In the companion post I introduced a problem with naive, window-based rate limiters – they're too forgiving! The user's request count is stored in a key in Redis with a TTL of, say, 15 minutes, and once the key expires, the abusive user can come back and immediately offend again. Effectively the abusive user is using your infrastructure to rate limit their requests.
In this post we'll investigate an alternative approach to windowed rate limiting which keeps a running estimate of each user's request rate and rejects requests for users whose rate is above the prescribed threshold. The focus of this post is on the math behind the approach. For a practical implementation, usage, and motivation for why the math might be worth looking at, please take a look at the companion post.
You've got a problem: a small subset of abusive users are body slamming your API with extremely high request rates. You've added windowed rate limiting, and this reduces the load on your infrastructure, but behavior persists. These naughty users are not attempting to rate-limit their own requests. They fire off as many requests as they can, almost immediately hit HTTP 429 Too Many Requests, and even then don't let up. As soon as a new rate limit window is available, the pattern starts all over again.
In order to curtail this behavior, it would be nice to penalize bad users according to their recent average request rate. That is, if a user responsibly limits their own requests, then they never get a 429. However if the user has the bad habit of constantly exceeding the rate limit, then we stop them from making any more requests – forever ... no new windows and no second chances... that is until they mend their ways and start monitoring their own rate more responsibly. Once their average request rate falls below the prescribed threshold, then their past sins are forgiven, and they may begin anew as a responsible user of our API.
About three and a half years ago I came up with a clever trick for accurately approximating and tightly bounding a cumulative distribution in a rather small data structure. It's high time that I blogged about it! In this post I'll talk about the problem space, my technique, the potential benefits of my approach over other approaches, and ways to improve in the future.
The skip list is one of my favorite data structures.
* It can be used to implement ordered lists or sets.
* It is easy to understand.
* It doesn't require any complex re-balancing like some of the other ordered-list structures.
* It's fast. And all of the operations - insert, search, delete - are O(log n) on average.
Click tracking is a way of boosting documents based upon the historical clickthrough rate that they received when surfaced in search results. Here's how it works: Let's say that we're building click tracking for an online store and we want to boost the documents that are getting the most attention. First you set up logging so that you can count how times a particular item is clicked. Next you have a process that aggregates the clicks across, say, a week, and you store the value in a click_count field along side the documents that you are serving from search. Finally, when someone performs a search you boost the results according to the click_count so that items with high clickthrough rates start surfacing higher in search results. But if you think hard, there's a pretty nasty problem with this approach.
(Can you figure it out?)
The problem is feedback. In the context of search results, the first page, and really, the first few results get all the love. Very few users are desperate enough to click through to the second page of results. So click tracking causes a nasty positive feedback dynamic to arise: The user are shown a page of results, user's only click into those results, thus those first-page items now get an additional boost. This makes it even more likely for these items to show up on the first page of results for other related searches, which exacerbates the problem, etc. One way of addressing this problem is by tracking the typical clickthrough rate and then boosting a document according to only how much it exceeds the typical clickthrough rate.
This is the first in a series of blog posts where we will examine how a more sophisticated version of click tracking can be implemented and we will examine some of the neat off-shoots of this work that allow you to things like turning click logs into judgement lists. But first we start with a very simple example... a very simple example:
Influence Marketing is a form of marketing in which focus is placed on specific key individuals rather than the target market as a whole. It identifies the individuals that have influence over potential buyers, and orients marketing activities around these influencers. (Yep, totes stole that from Wikipedia.)
If you've been friends with me for very long, you've probably heard me reference my mysterious side-project, the social-network-infiltrator! Basically it is a Twitter graph scraper that is able to apply simple algorithms and answer interesting questions. Questions like:
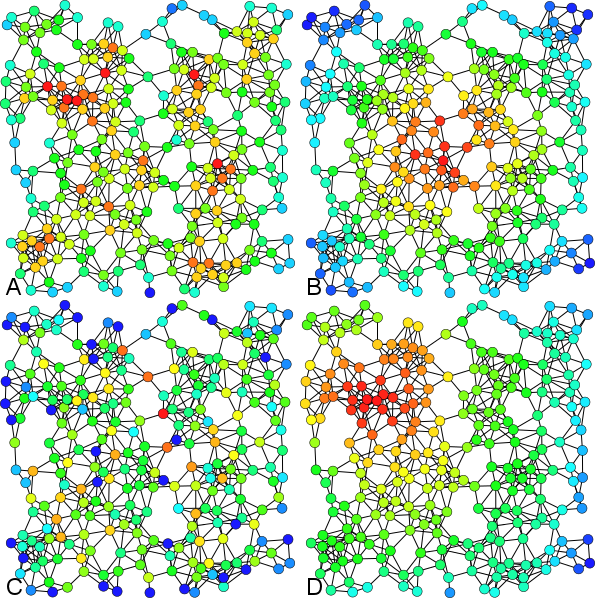
If you play around much with graphs, one of the first things that you'll run into is the idea of network centrality. Centrality is a value associated with a node which represents how important and how central that node is to the network as a whole. There are actually quite a few way of defining network centrality - here are just a few:
Examples of A) Degree centrality, B) Closeness centrality, C) Betweenness centrality, D) Eigenvector centrality. -- Figure shamelessly stolen from Wikipedia
Degree centrality - This, the simplest measure of centrality, is simply the count of how many a connections a particular node has.
Closeness centrality - This is the inverse of a node's farness. Farness, in turn, is the sum of the length of the shortest paths connecting the node in question to all other nodes.
Betweenness centrality - This is the count of number of shortest paths that pass through a given node.
But, my favorite measure of centrality is eigenvector centrality. Why? Because I invented it! Ok, ok... that's not exactly true, but I did at least independently discover it. And the way I discovered it helped it stick in my mind ever since.