Better Click Tracking for Identifying Statistically High Performers - Part I
16 Apr 2018Click tracking is a way of boosting documents based upon the historical clickthrough rate that they received when surfaced in search results. Here’s how it works: Let’s say that we’re building click tracking for an online store and we want to boost the documents that are getting the most attention. First you set up logging so that you can count how times a particular item is clicked. Next you have a process that aggregates the clicks across, say, a week, and you store the value in a click_count field along side the documents that you are serving from search. Finally, when someone performs a search you boost the results according to the click_count so that items with high clickthrough rates start surfacing higher in search results. But if you think hard, there’s a pretty nasty problem with this approach.
(Can you figure it out?)
The problem is feedback. In the context of search results, the first page, and really, the first few results get all the love. Very few users are desperate enough to click through to the second page of results. So click tracking causes a nasty positive feedback dynamic to arise: The user are shown a page of results, user’s only click into those results, thus those first-page items now get an additional boost. This makes it even more likely for these items to show up on the first page of results for other related searches, which exacerbates the problem, etc. One way of addressing this problem is by tracking the typical clickthrough rate and then boosting a document according to only how much it exceeds the typical clickthrough rate.
This is the first in a series of blog posts where we will examine how a more sophisticated version of click tracking can be implemented and we will examine some of the neat off-shoots of this work that allow you to things like turning click logs into judgement lists. But first we start with a very simple example… a very simple example:
Meet Milton Acme, the Founder and CEO of Acme Plumbing
Milton Acme, Founder/CEO: Howdy! I’m Milton Acme, Founder and CEO of ACME Plumbing and it’s high time that we joined the ranks of our competitors and became part of the computer-net-world.
Me: Uh… the Internet. Right. So I’ve got a pretty extensive history working with companies like yo…
Milton Acme, Founder/CEO: And here’s how we’re going to do it! Introducing ACME Thing-o-the-Moment!!
Milton asks his secretary to pull up their home page and then points a fat finger at the screen.
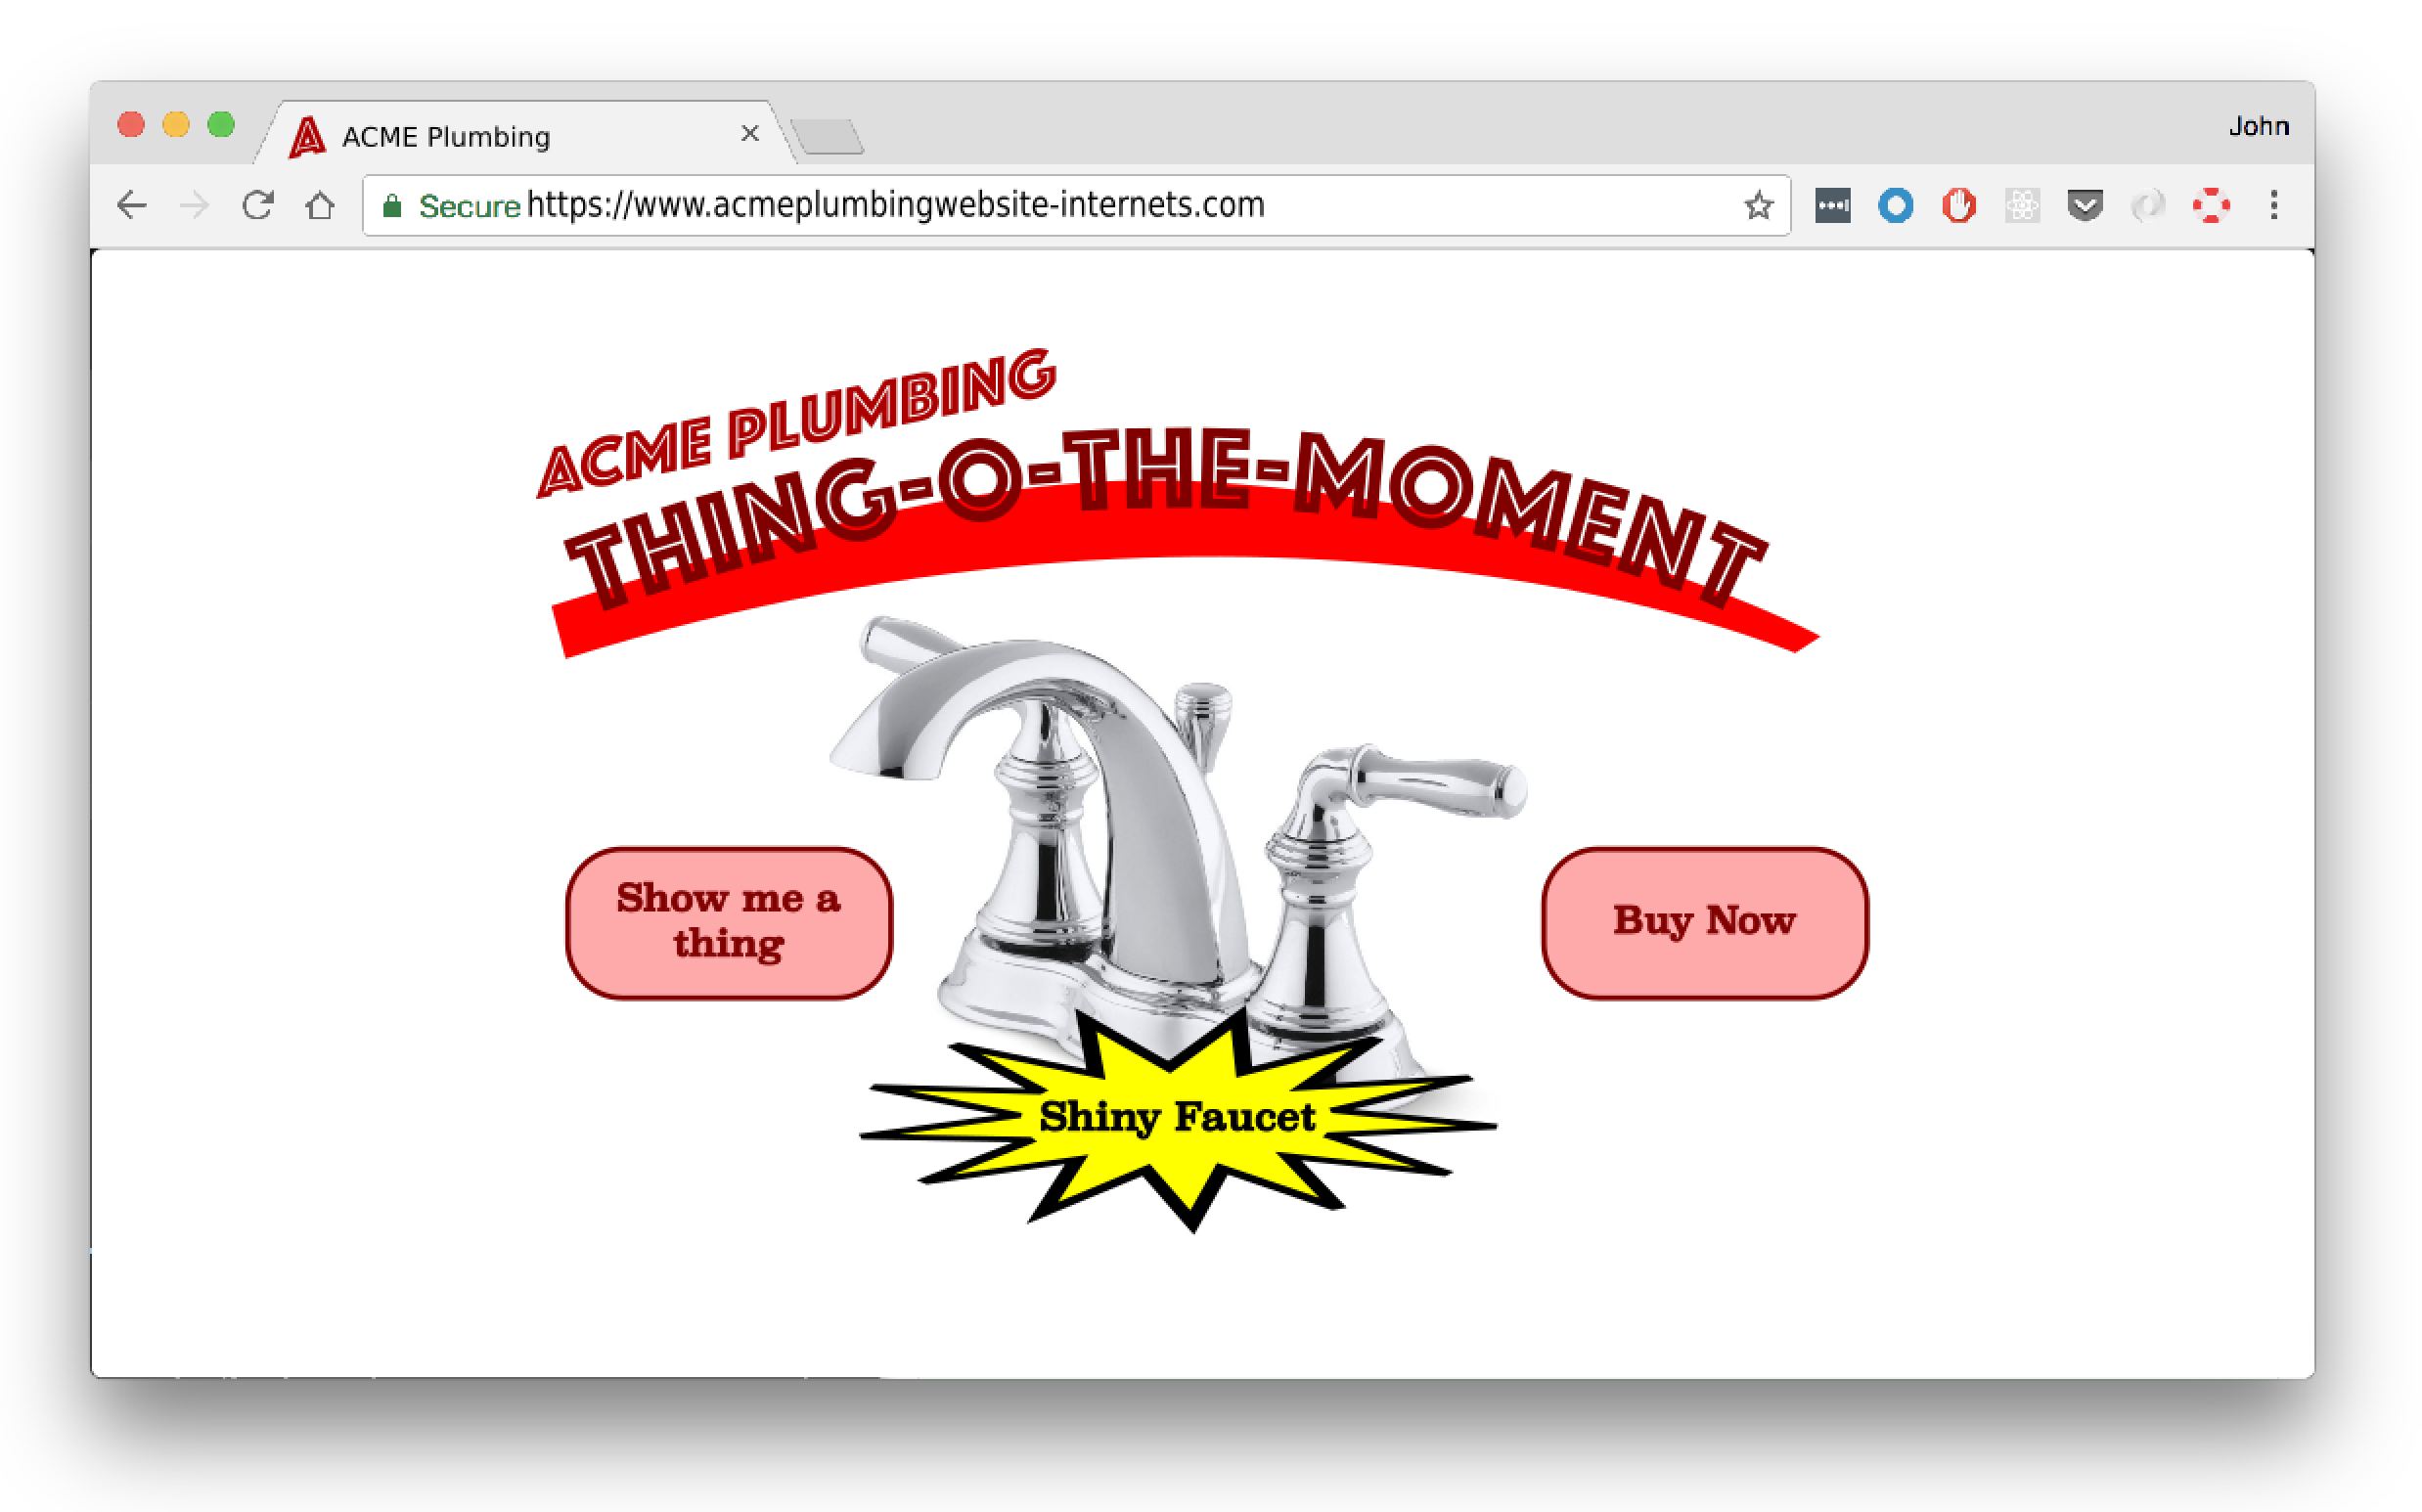
It might be the dumbest application I’ve ever seen. You go to the website, click the “Show Me a Thing” button and poof! you are shown a random item in the catalog. Wanna buy it? Then click the “Buy Now” button.
Milton Acme, Founder/CEO: This has been running for weeks now. But the idiot programmers I fired last week just weren’t showing the right products. And that’s why I called you. I heard you have some special, click tracking contraption and I want you to deploy it for ACME Plumbing.
Me: Sure, yeah, but this is a ridiculous interface. Why don’t you invest in a search app like a normal e-commerce company.
Milton Acme, Founder/CEO: Non-sense! We are on the World-Wide-Web. Corporate domination is at hand.
Me: Yeah but, how do your customers find what…
Milton Acme, Founder/CEO: …This is a new day! The world is our oyster!
Me: But let’s say I want to buy a toilet seat. How…
Milton Acme, Founder/CEO: With the power of the inter-nets we will catch more fish than ever. And by “fish” I mean customers. Sales, my boy! Sales!
Me: <stunned silence>
So I get to work. We start logging all of the views and all of the clickthrough. The two tables look like this:
ViewLog
| exposure_id | product_id |
|---|---|
| 3218971 | toilet_seat |
| 4522458 | presto_plunger |
| 7613493 | toilet_seat |
| 7654234 | shiny_faucet |
| 1120633 | presto_plunger |
| 5321763 | presto_plunger |
| 6423134 | toilet_seat |
| 8675309 | presto_plunger |
ClickLog
| exposure_id | product_id |
|---|---|
| 3218971 | toilet_seat |
| 7613493 | toilet_seat |
| 7654234 | shiny_faucet |
| 5321763 | presto_plunger |
| 6423134 | toilet_seat |
| 8675309 | presto_plunger |
In old-school click-tracking we could just count up which things get the most clicks and boost according to that:
SELECT
    product_id,
    count(*) cnt
FROM ClickLog
GROUP BY product_id
resulting in:
| product_id | cnt |
|---|---|
| presto_plunger | 88 |
| toilet_seat | 41 |
| shiny_faucet | 2 |
| toilet_glue | 15 |
| … | … |
We see here that presto_plunger leads toilet_seat in clicks by about 2 to 1 which would seem to indicate that the Presto Plunger is better than the toilet seat. But as mentioned above, this is misleading. To get a more complete picture, let’s look at the a query that pulls out the number of views, number of clicks, and the clickthrough rate:
SELECT
    product_id,
    click_count,
    view_count,
    click_count/view_count clickthrough_rate
FROM (
    SELECT
        count(*) click_cnt,
        product_id
    FROM ClickLog
    GROUP BY product_id
) Clicks
JOIN (
    SELECT
        count(*) view_cnt,
        product_id
    FROM ViewLog
    GROUP BY product_id
) Views
ON product_id
| product_id | click_count | view_count | clickthrough_rate |
|---|---|---|---|
| presto_plunger | 88 | 7903 | 0.012 |
| toilet_seat | 41 | 379 | 0.108 |
| shiny_faucet | 1 | 3 | 0.333 |
| … | … | … | … |
It’s now evident that even though the Presto Plunger got a lot more clicks, it’s view count was huge - consequently it’s clickthrough rate was really quite small - 1.2%.
But look closer, there’s still more to be uncovered here. Check out the clickthrough rate for that shiny faucet - 33.3%! But perhaps you can see that we have a new problem here. It’s only been viewed 3 times! It’s entirely likely that it’s popularity is spurious. If the shiny faucet was viewed more then we would get a better picture of its actual clickthrough rate.
Promoting Items with Statistically Significant Clickthrough
So here’s where the magic happens. We know that we can’t just promote the items with the highest click count otherwise we would promote the Presto Plunger which has the highest click count merely because it’s been shown 20 times more than any other item. And we know that we can’t just promote the items with the highest clickthrough rate because occasionally you’ll get items like the shiny faucet that have superficially high clickthrough rate simply because they’ve been viewed a few times and one of those times got a click.
Our goal then is to identify the items that we are confident really do have a higher-than-normal clickthrough rate. And in order to identify these items we introduce one more piece of information - the overall clickthrough rate. If we roll up the previous result set across all items in the catalog…
SELECT
    sum(click_count) total_click_count,
    sum(view_count) total_view_count,
    total_click_count/total_view_count overall_clickthrough_rate
FROM ThePreviousResultSet_UpAParagraphOrTwo
GROUP BY product_id
| total_click_count | total_view_count | overall_clickthrough_rate |
|---|---|---|
| 8716 | 164371 | 0.05302760219 |
…then we see that the overall clickthrough rate across all products is 5.3%.
With the overall clickthrough rate we can now identify items whose clickthrough rates are significantly higher than the overall clickthrough rate. And here we mean significant in a statistical sense. What we’re talking about here is effectively A/B testing the performance of each individual product against the average performance across all the products.
Let’s take a look at how we would determing statistical significance in the case of the shiny faucet. The shiny faucet has three views and one click. If the true clickthrough rate is just the same as the overall clickthrough rate, 5.3%, (the “null hypothesis”), then is seeing a 33.3% clickthrough rate (just one click) significant or not? Well if you have 3 views, then there are only 4 possible outcomes: 0 clicks, 1 click, 2 clicks, or 3 clicks. And since we know that the associated probabilities follow a binomial distribution with n=3 and p=0.053, then we know that the probabilities for each possible outcome is as follows:
| outcome | probability of getting exactly this many clicks | probability of getting at least this many clicks |
|---|---|---|
| 0 clicks | 0.8493 | 1.0 |
| 1 click | 0.1426 | 0.1507 |
| 2 clicks | 0.0079 | 0.0081 |
| 3 clicks | 0.0002 | 0.0002 |
So if the actual clickthrough rate is 5.3%, then likelihood of getting 1 or more clicks is ~15%. This result is not that significant at all. This means that the shiny faucet might be a pretty normal item but we won’t know for sure until we see some more views and clicks.
On the other hand let’s look at that toilet seat which was clicked 41 out of the 379 times it was viewed for a clickthrough rate of 10.8%. That’s 2.04 times better clickthrough rate than the average item. And by applying the exact same analysis as above (though with a list of 380 possible outcomes) we see that the probability of getting 41 or more clicks just by chance is minuscule - roughly 0.0015%! This is very statistically significant! Let’s promote the toilet seat!
Implementation
This is what we’ll do for ACME: we will track the performance of every item in their catalog according to these two metrics:
- Strength - We define this as the clickthrough rate of the item divided by the overall clickthrough rate. For the shiny faucet,
strength = .333/.053 = 6.28. For the toilet seatstrength = .108/.053 = 2.04. - Statistical Significance - This is defined as a p-value as described above. For the shiny faucet this is 0.1507. For the toilet seat this is 0.000015. The low value associated with the toilet seat indicates that its performance has much greater statistically significance than that of the shiny faucet - we can be confident that it’s high strength value is accurate.
Given these metrics, we will find all the items that have significantly higher performance (in the statistical sense) and we will store their strength in a new field in each document. Then we will boost according how strong they are. Periodically, we will run the same analysis on new log data and update the strength fields and boosts accordingly.
Milton is Pleased!
Milton Acme, Founder/CEO: My boy! You done us good with your work so far…
Me: Please don’t call me “boy”, Mr. Acme.
Milton Acme, Founder/CEO: …but I’ve got bigger plans for Acme Plumbing. And Jim, you are the key to getting us there.
Me: Thank you! I guess. … And my name’s John.
Despite the quirky nature of this project, it demonstrates some of the basic ideas of how to gather logs and extract statistics so that we can estimate the “strength” of an item relative to the rest of the catalog. We can also measure statistically significance so that we know how confident we can be in those strength values.
From here we can start doing more complicated and interesting things. In upcoming posts I will extend what we learned here to ordered sets of results like you would see in a real search application. Later we will update our techniques further to understand the strength of items within individual queries. And finally we will show that this same set of data can be used for building judgement lists, which opens up the possibility of learning-to-rank.
Till then, thanks for reading!